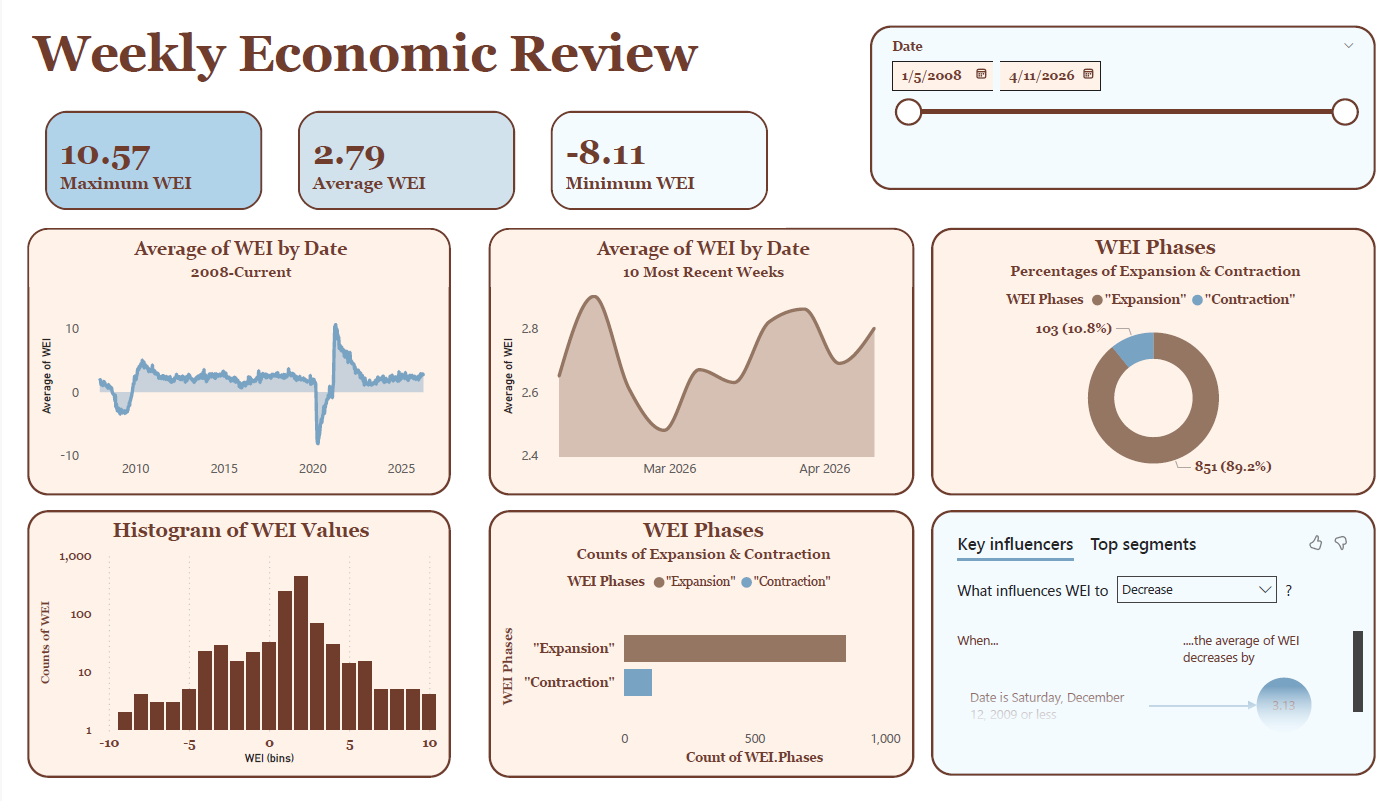
This analysis utilizes weekly economic index (WEI) values
to examine the economic conditions in the United States.
Data is collected from the Federal Reserve Bank of Dallas,
where WEI's are updated weekly.
A brief time series analysis is conducted
following each update with the most recent data.
Each analysis will investigate long-term and short-term trends.
WHAT IS THE WEI?
The WEI is a composite index that combines various economic indicators,
including consumer behavior, labor market conditions, and production metrics.
This measure can be used to make inferences about the overall health of America's economy.
The WEI can be understood as an estimated GDP growth rate,
where positive values indicate economic expansion
and negative values indicate contraction.
It is important to note that these values are not exact GDP growth rates,
but rather estimates based on a combination of economic indicators.
WEI values are collected at a high frequency,
so interpretations should be made across persisting trends,
rather than individual data points.
HOW IS WEI CALCULATED?
A dynamic factor model is employed
from the development of ten different daily
and weekly time series.
The comovements of a vector of N time series variables
is driven by some small number of common factors, ft,
which are estimated using principal components.
This model assumes an observed series
representing the total dynamic effect of the common factors,
as well as an error term:
Xt=
λ(L)ft
+εt
Components of a vector of lag polynomials λ(L)
are used to capture the dynamic factor loadings.
The dynamic factor is then expressed in static form
by stacking the common components λi(L)ft
+εt into a vector Ft
resulting in λ(L)dimensions.
REFERENCES:
Federal Reserve Bank of Dallas. (2023). Weekly Economic Index. Retrieved from https://www.dallasfed.org
Lewis D.J., Mertens, K., Trivedi, M., Stock, H.J. (2021). Measuring Real Activity Using a Weekly Economic Index